
English
English
Appearance
The Gantt view displays tasks and milestones on a horizontal timeline. It is the standard view for project planning and progress tracking.
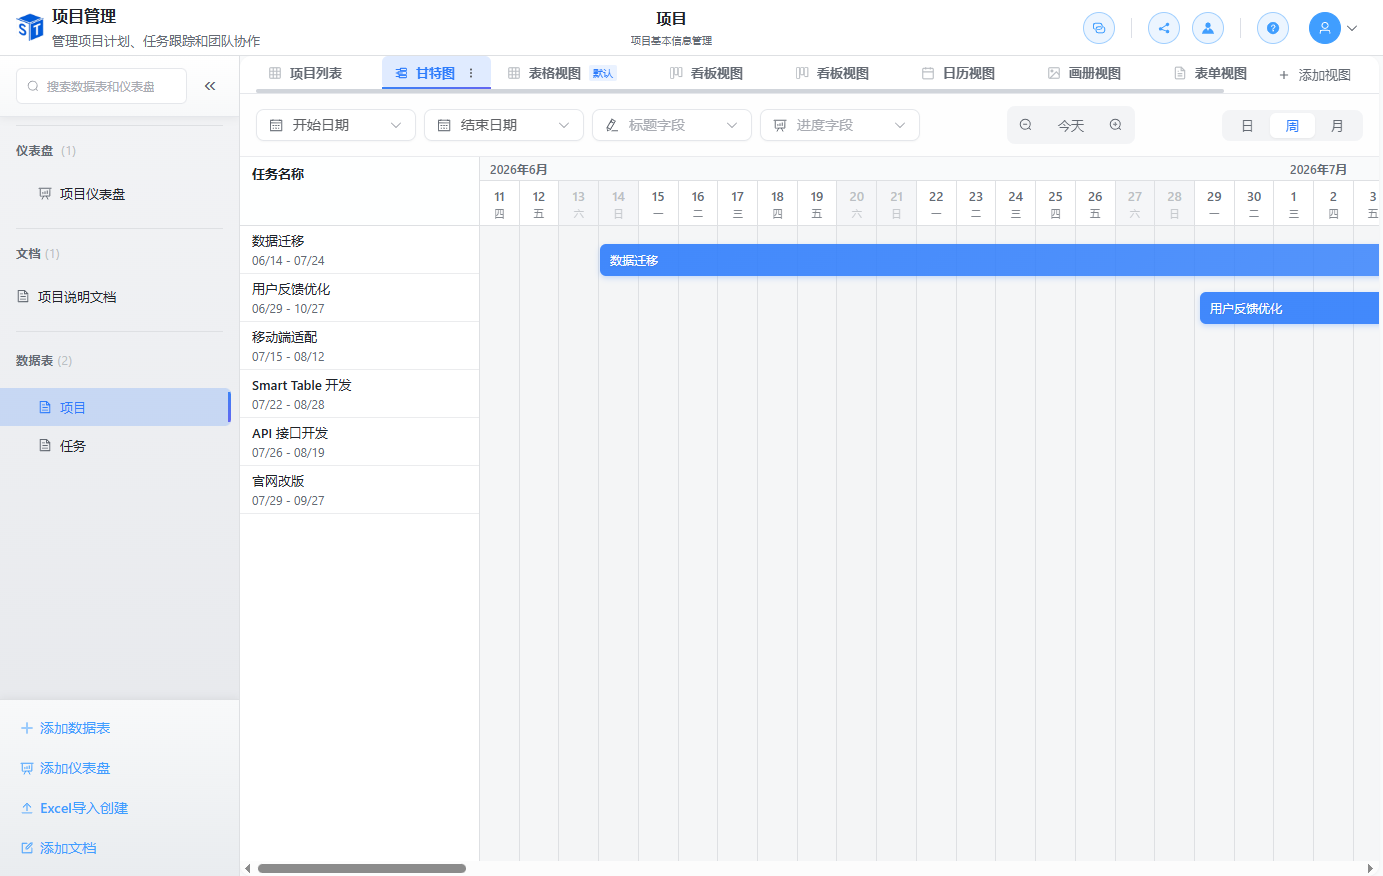
| Action | How To |
|---|---|
| Set dates | Use Date or Date Time fields for start and end times |
| Add dependencies | Link tasks to show predecessor/successor relationships |
| Adjust schedule | Drag the task bar or its edges to change dates |
| Track progress | Link a Progress field to see completion on each bar |
Required Fields
Gantt view needs at least a task name and a start/end date field. Adding a Progress field makes the chart more informative.