Skip to content

Dashboard Management

SmartTable Dashboard is a visual data presentation tool that supports combining multiple charts and display components through drag-and-drop. Configurations can be saved as templates or shared externally. Dashboard data can be linked to tables in real time, making it suitable for project boards, operation monitoring, and data dashboards.
When to Use

  • Project progress overview boards
  • Sales/operations data monitoring
  • Team KPI display screens
  • Real-time data stream monitoring

Accessing Dashboards

  1. Enter any Base page.
  2. Switch to the Dashboards tab in the left sidebar.
  3. Click a dashboard name to enter view or edit mode.
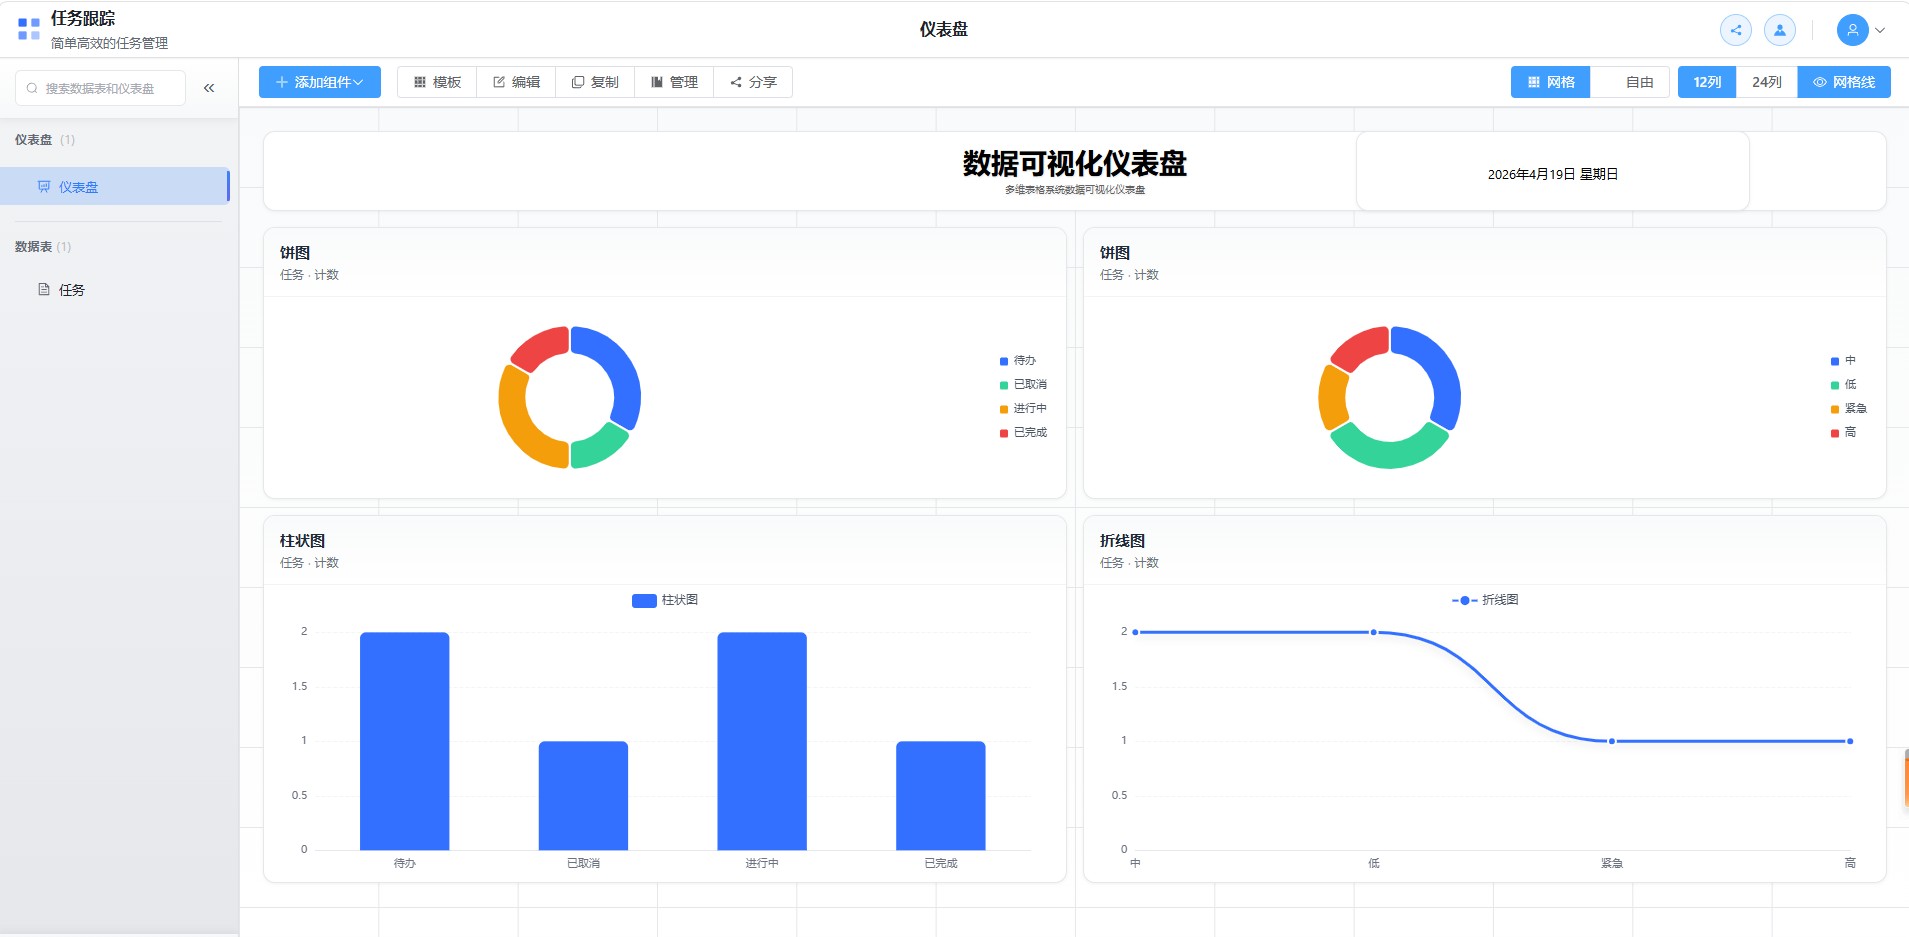
Dashboard overview

Dashboard Operations

Creating a Dashboard

  • Click the + New Dashboard button at the top of the sidebar.
  • Enter a dashboard name and description, then create it.
  • The system automatically enters edit mode after creation.

Renaming and Deleting

  • Right-click a dashboard in the sidebar and select Rename or Delete.
  • Deletion cannot be undone; please back up important configurations in advance.

Starring Dashboards

  • Click the star icon next to a dashboard name to pin frequently used dashboards.
  • Starred dashboards appear at the top of the sidebar for quick access.

Layout System

Dashboards use a grid layout engine that supports free dragging and resizing of widgets.

Grid Layout

  • Default is a 12-column grid system; can be switched to 24-column for finer control.
  • Each widget occupies a number of grid cells, and width/height can be adjusted by dragging.
  • Widgets automatically snap to the grid to avoid overlap.

Free Layout

  • Can be switched to free layout mode for more flexible widget positioning.
  • In free layout, widget z-index can be set.

Layout Configuration

ConfigurationDescription
Columns12 or 24 columns
Row HeightHeight of each grid row
GapSpacing between widgets
PaddingDashboard padding
Grid LinesWhether to show alignment grid lines

Widget Types

Dashboards support multiple widget types, divided into charts, data, and display categories.

Charts

WidgetDescription
Bar ChartCompare categorical data
Line ChartShow data trends over time
Pie ChartShow proportions of a whole
Area ChartEmphasize magnitude change over time
Scatter ChartShow relationships between two variables
Radar ChartMulti-dimensional data comparison
Funnel ChartShow conversion rates across stages
Gauge ChartShow completion of a single metric

Data

WidgetDescription
Number CardHighlight key metrics
Data TableDisplay detailed data in table form

Display

WidgetDescription
ClockShow current time, supports 12/24-hour format
DateShow current date, supports multiple date formats
MarqueeScroll notifications or messages
KPILarge-screen KPI display with trend and target values
Realtime StreamDynamically display latest data changes

Adding and Configuring Widgets

Adding a Widget

  1. In dashboard edit mode, click the Add Widget button.
  2. Select a widget type.
  3. The widget is automatically placed on the canvas.

Configuring Data Source

Most data widgets require a data source configuration:

  1. Select Table: Specify the table the widget reads from.
  2. Select Value Field: Choose the numeric field to aggregate.
  3. Select Aggregation: Such as sum, average, count, max, min, etc.
  4. Select Group By Field (optional): Group data by a field.
  5. Set Filter Conditions (optional): Only aggregate records matching conditions.

Style Configuration

Each widget supports rich style configuration:

ConfigurationDescription
ThemeDefault, Blue, Green, Orange, Purple, Red, Dark
Background ColorWidget background color
Border Color/Width/RadiusWidget border style
ShadowWhether to show shadow
Font SizeOverall widget font size
Title Font Size/ColorWidget title style

Chart Configuration

Chart widgets additionally support:

  • Custom colors
  • Show/hide legend
  • Show value labels and label position
  • Smooth curves for line/area charts
  • Stacked display for bar/area charts

Behavior Configuration

ConfigurationDescription
Enable AnimationAnimation effects on widget load and update
Animation DurationAnimation duration
Refresh IntervalData auto-refresh frequency, from 1 second to 5 minutes
Enable InteractionWhether click, hover, and other interactions are supported

After configuration, you can preview the dashboard in design or view mode:
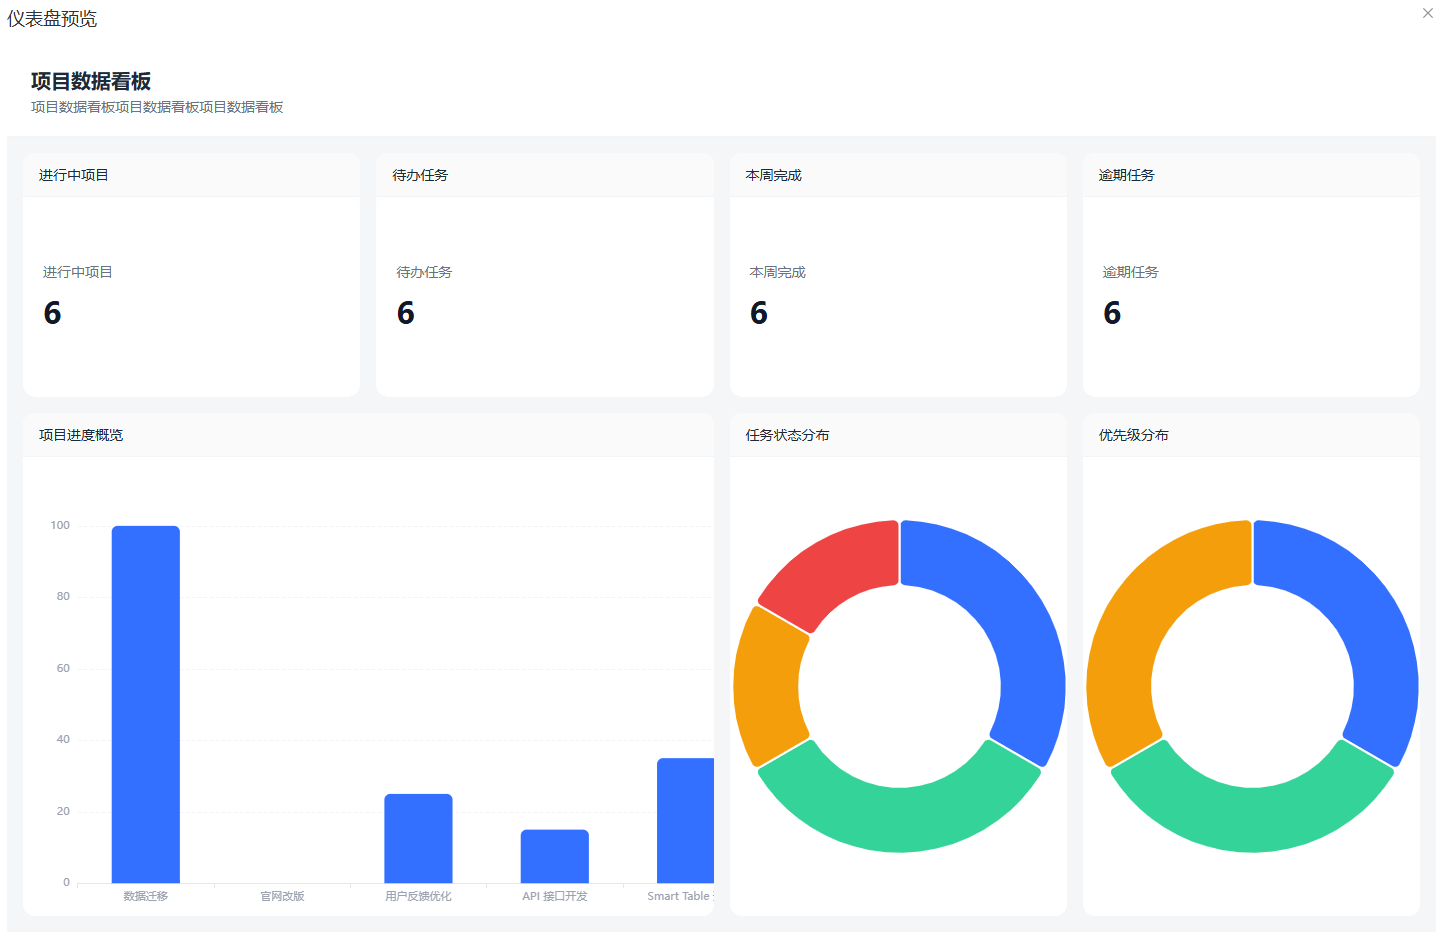
Dashboard preview

Template Management

Dashboard templates

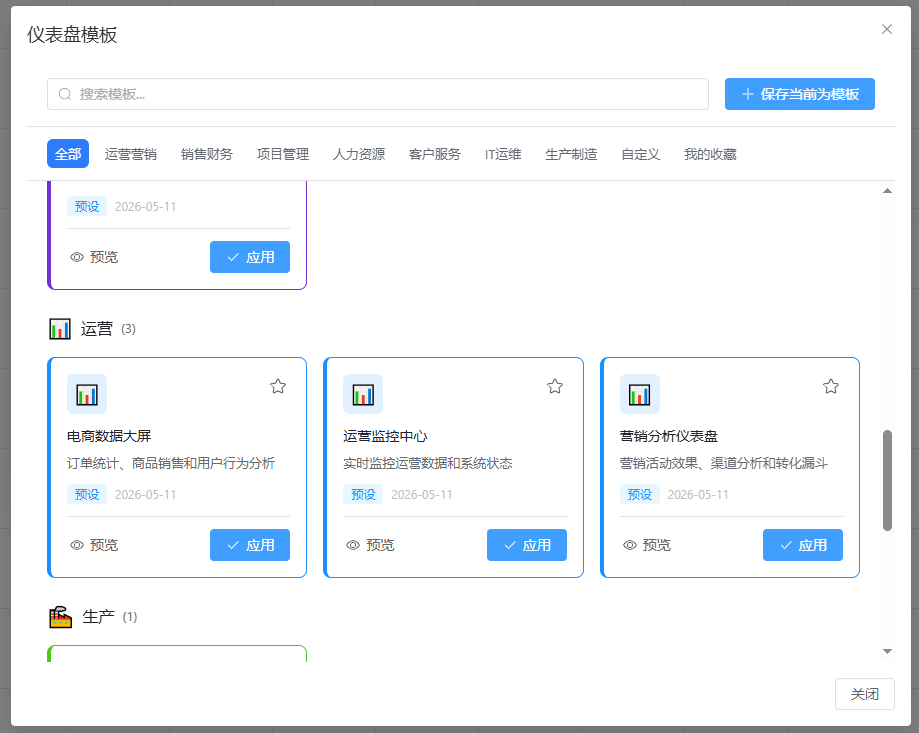
Dashboards support saving the current configuration as a template for quick reuse.

Saving a Template

  1. In edit mode, click Save as Template.
  2. Enter a template name and description.
  3. Click save; all current widgets and layout are saved as a template.

Using a Template

  1. When creating a new dashboard, choose Create from Template.
  2. Select a suitable template from the list.
  3. The system automatically generates the widget layout based on the template; just modify the data source to start using it.

Real-time Data

Dashboards support real-time data updates:

  • After enabling real-time collaboration, changes in tables are reflected on the dashboard.
  • Widget refresh intervals can be configured for scheduled automatic refresh.
  • The Realtime Stream widget dynamically displays the latest data changes.

Sharing Dashboards

Dashboards support generating public share links for external viewers.

Creating a Share

  1. Click the Share button on the dashboard page.
  2. Configure share options:
    • Share Title/Description: Helps recipients understand the content
    • Expiration: Default 7 days, customizable in hours
    • Max Access Count: Limit total link accesses
    • Access Code: Requires a password to view when enabled
    • Permission: View only (editing not supported)
  3. Click create and copy the generated share link.

Managing Shares

  • Multiple share links can be created for one dashboard.
  • Share links can be disabled or deleted at any time.
  • Access counts and status can be viewed for each link.

Embedding in External Websites

After obtaining the share link, the dashboard can be embedded into external websites or large-screen systems via iframe.

Security Suggestion

Only display public data on shared dashboards, and avoid exposing sensitive business information through share links. It is recommended to set access codes and expiration dates for important dashboards.

Next Steps

Released under the MIT License.